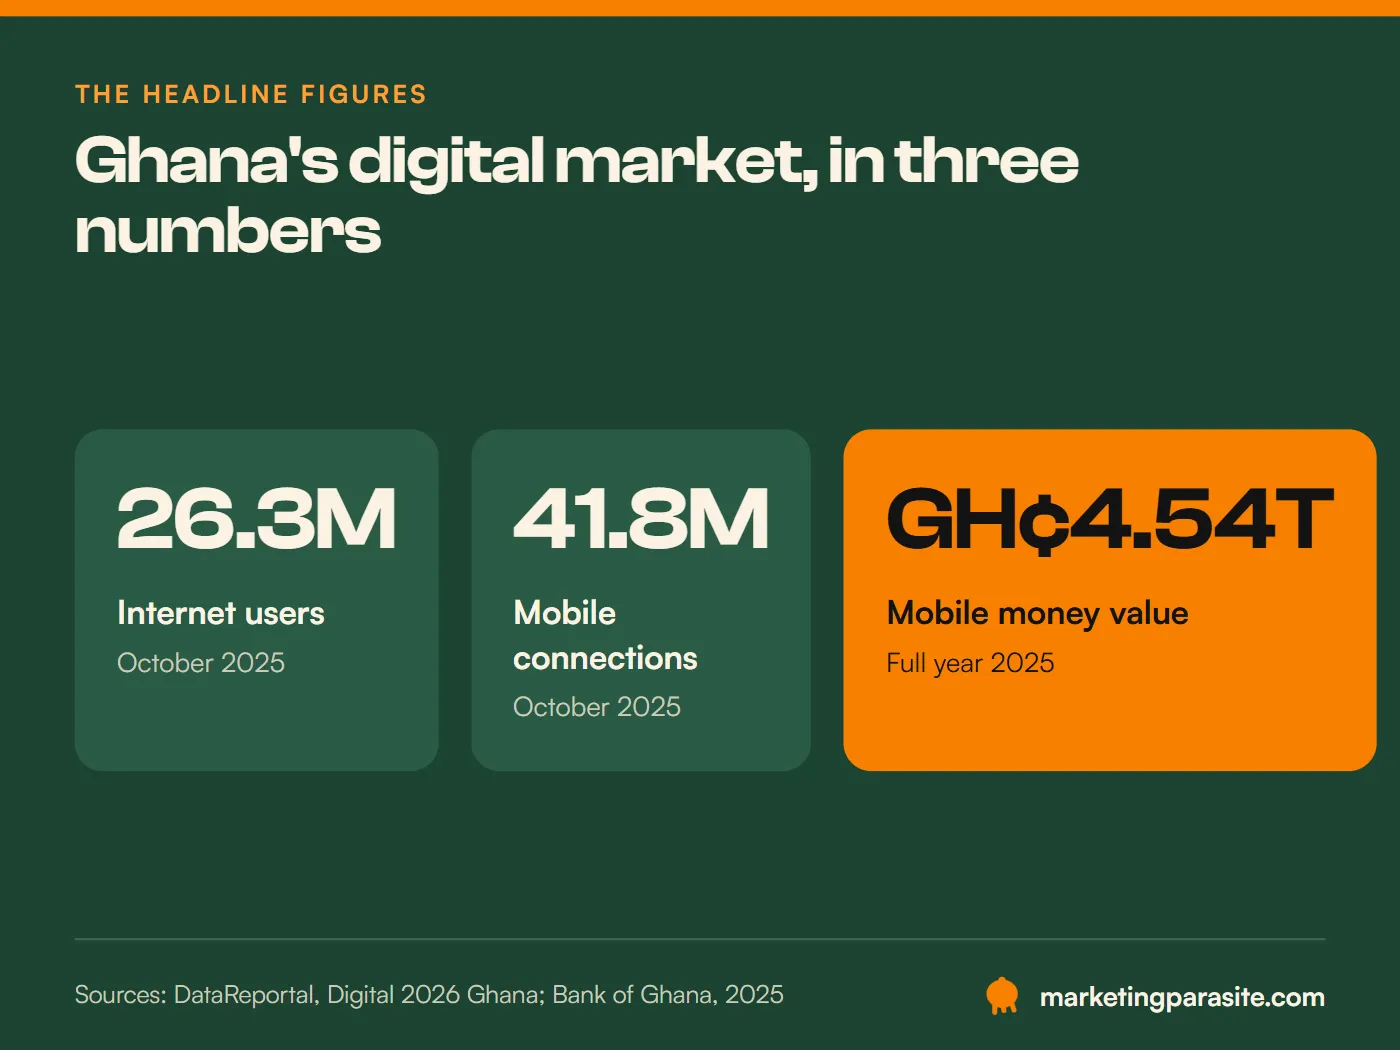
Ghana had 26.3 million internet users in October 2025. It had 41.8 million mobile connections. And mobile money moved GH¢4.54 trillion over the year.
These are the Ghana digital marketing statistics everyone quotes. They tell you surprisingly little about how easily a business can find a customer online and win them.
Look closer and the numbers start to disagree. YouTube has the biggest social media audience in Ghana, but Facebook sends most of the social media visits to Ghanaian websites, in every month of the last year. Mobile money handles trillions of cedis, yet online shopping is still under 5% of retail. None of this is a contradiction. Each figure measures something different, and that difference is where the useful part is.
Most roundups stop at the headline numbers. This one uses published figures from DataReportal, the National Communications Authority, StatCounter, the Bank of Ghana and ECDB, names the source and date under every table, and says plainly where the evidence stops.
Ghana is more connected every year. The reachable market is smaller than it looks
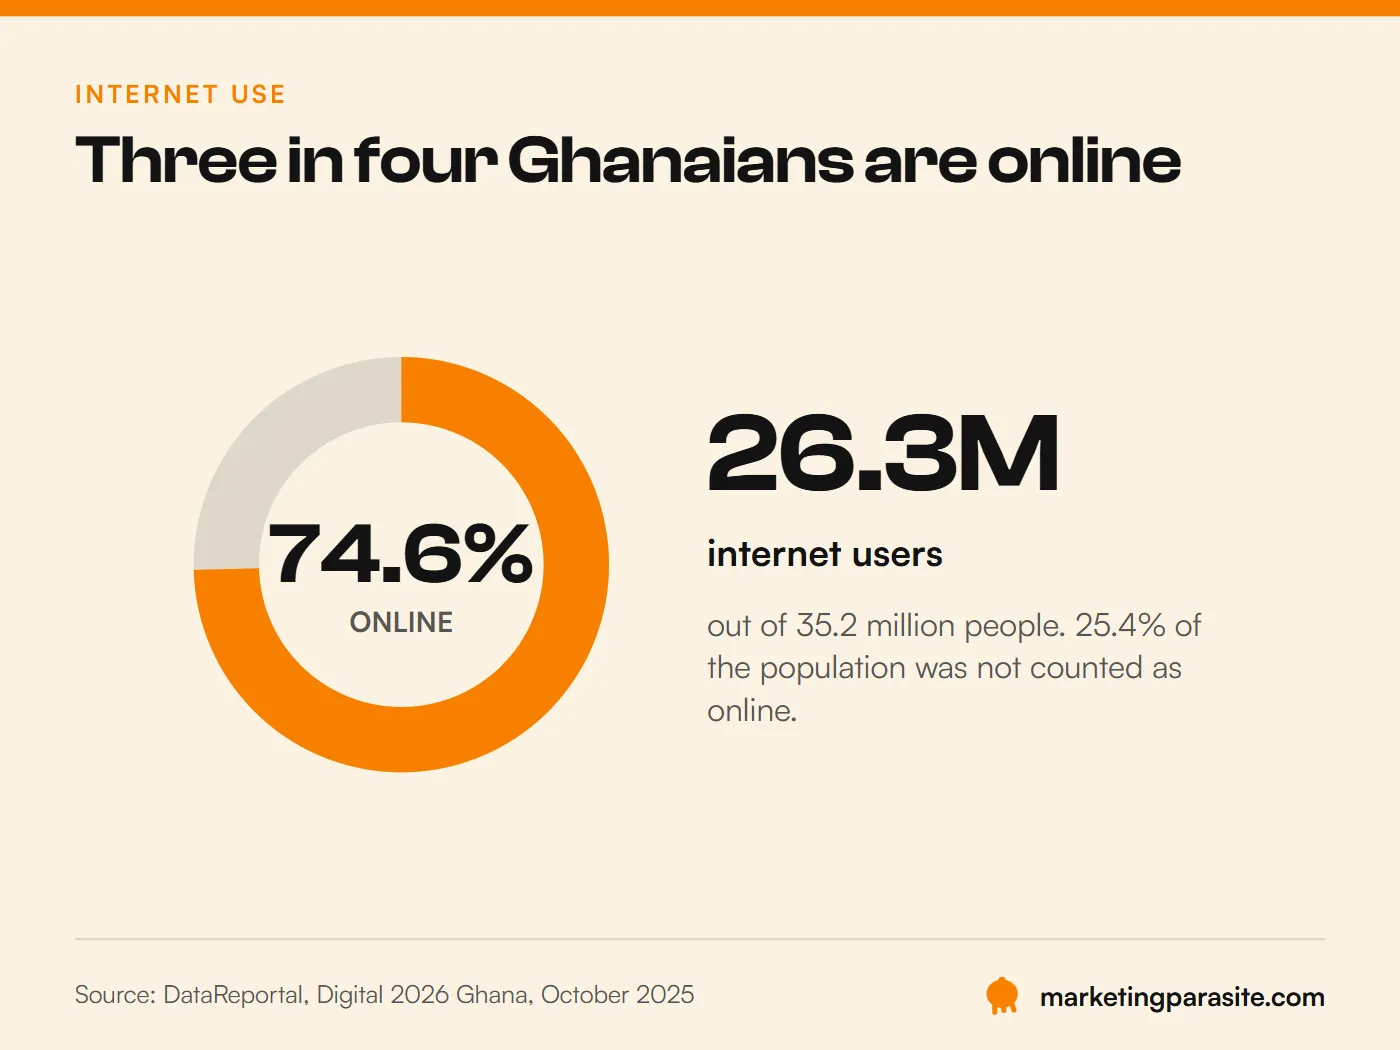
In October 2025, Ghana’s population stood at 35.2 million. About 26.3 million of them used the internet, an internet penetration of 74.6%.
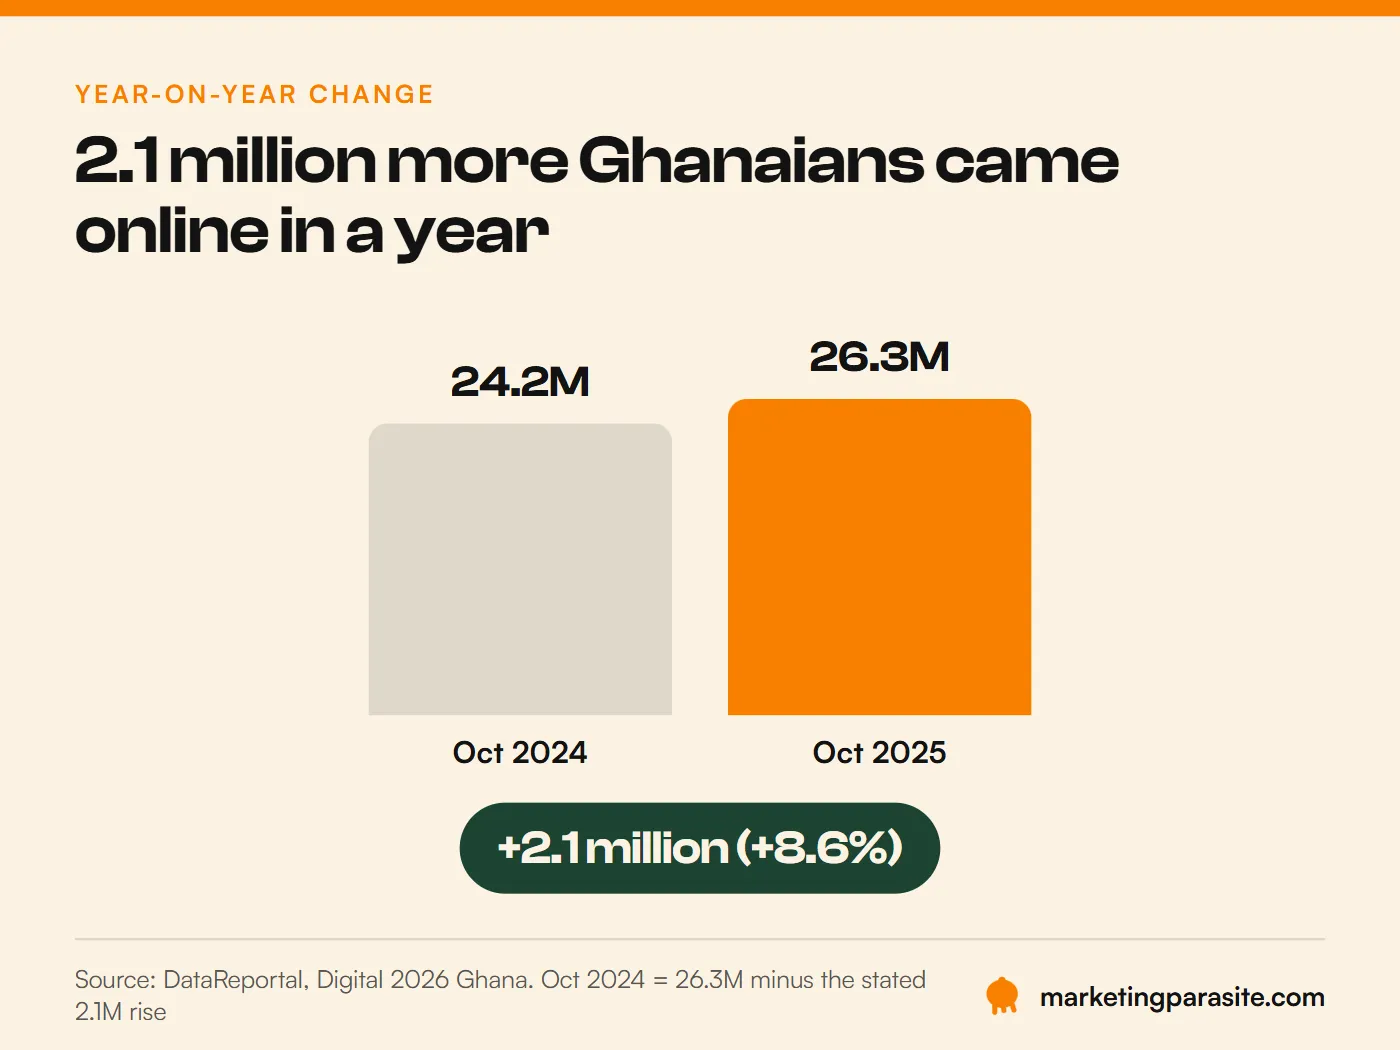
That figure grew by 2.1 million people, or 8.6%, between October 2024 and October 2025. For any business selling online, that is the most encouraging number on this page: the audience is still growing.
Ghana’s internet and connectivity statistics
| Indicator | Figure |
|---|---|
| Population | 35.2 million (October 2025) |
| Internet users | 26.3 million, 74.6% of the population |
| Change in internet users, Oct 2024 to Oct 2025 | +2.1 million (+8.6%) |
| Mobile connections | 41.8 million, 119% of the population |
| Mobile connections that are broadband (3G, 4G, 5G) | 96.0% |
| Mobile data subscriptions | 29.73 million, March 2026 (NCA) |
| Fibre broadband subscriptions | 273,095, March 2026 (NCA) |
| Median fixed download speed | 49.50 Mbps, late 2025 |
| Urban / rural population | 60.6% urban, 39.4% rural |
Source: DataReportal, Digital 2026 Ghana, October 2025 data, unless the row names the National Communications Authority (NCA), Q1 2026 Statistical Bulletin.
Why Ghana has more mobile connections than people
There are 41.8 million mobile connections and 35.2 million people. That is not a mistake in the census. Connection figures count SIM cards, not people, and plenty of Ghanaians carry two: one for each network, or one for personal use and one for business.
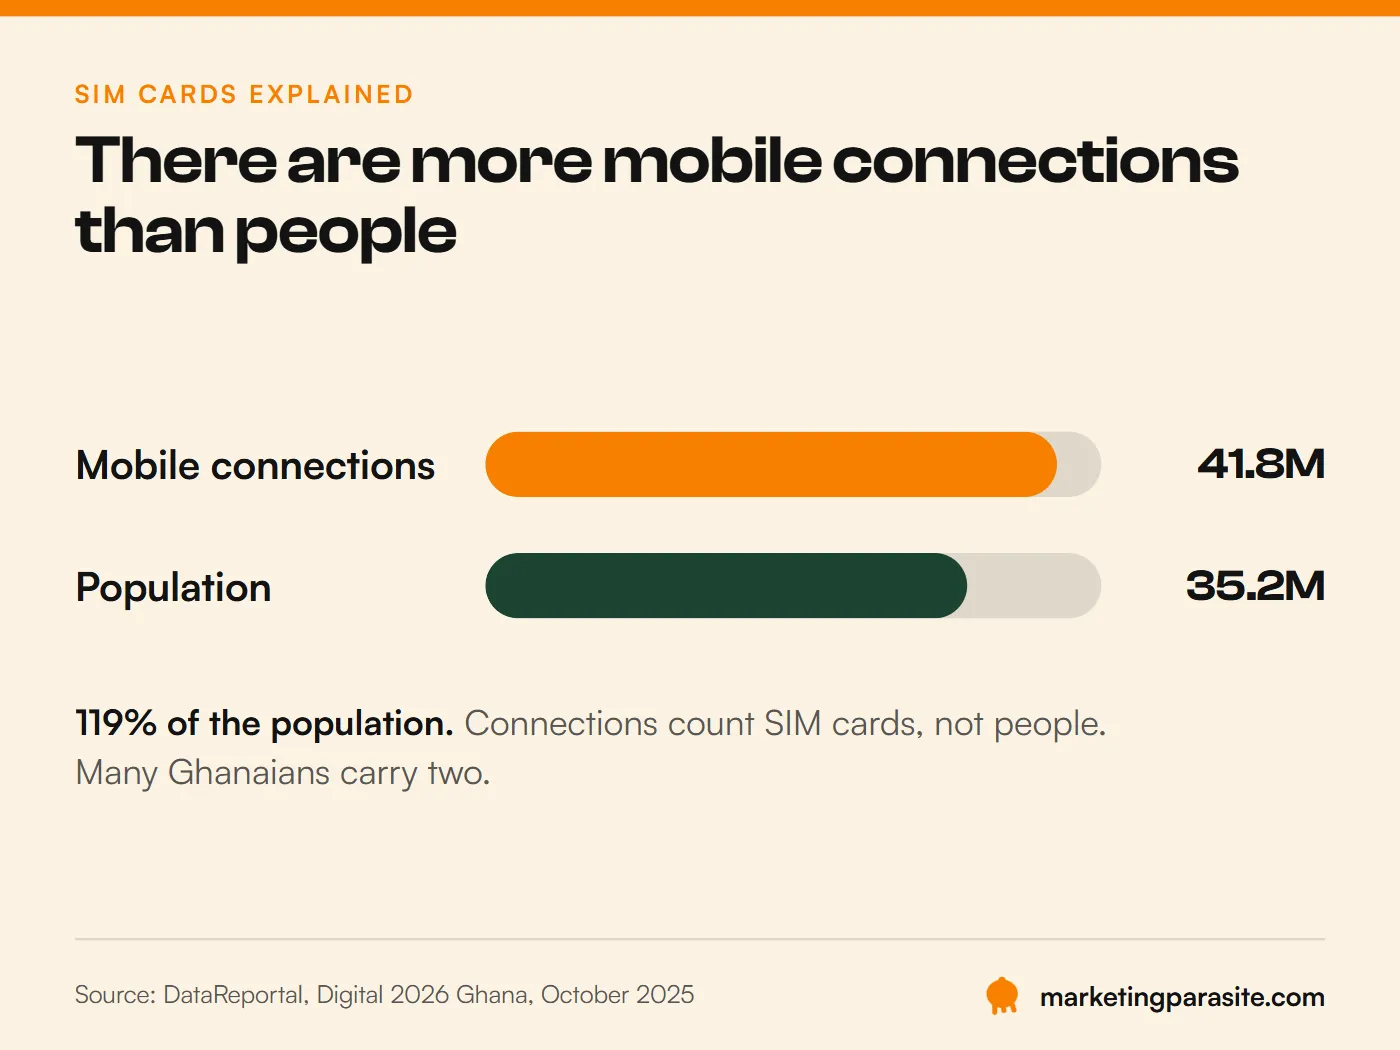
So never size a market off a subscriber count. A business that treats every connection as a separate customer can overestimate its reach by millions. Even the 26.3 million internet users is a ceiling, not a target. It does not tell you who wants your product, lives where you deliver, or can afford it.
The national average hides two different countries
60.6% of Ghanaians live in towns and cities, and 39.4% in rural areas. The published figures do not split internet use between the two, so nobody can honestly tell you how many rural Ghanaians are online.
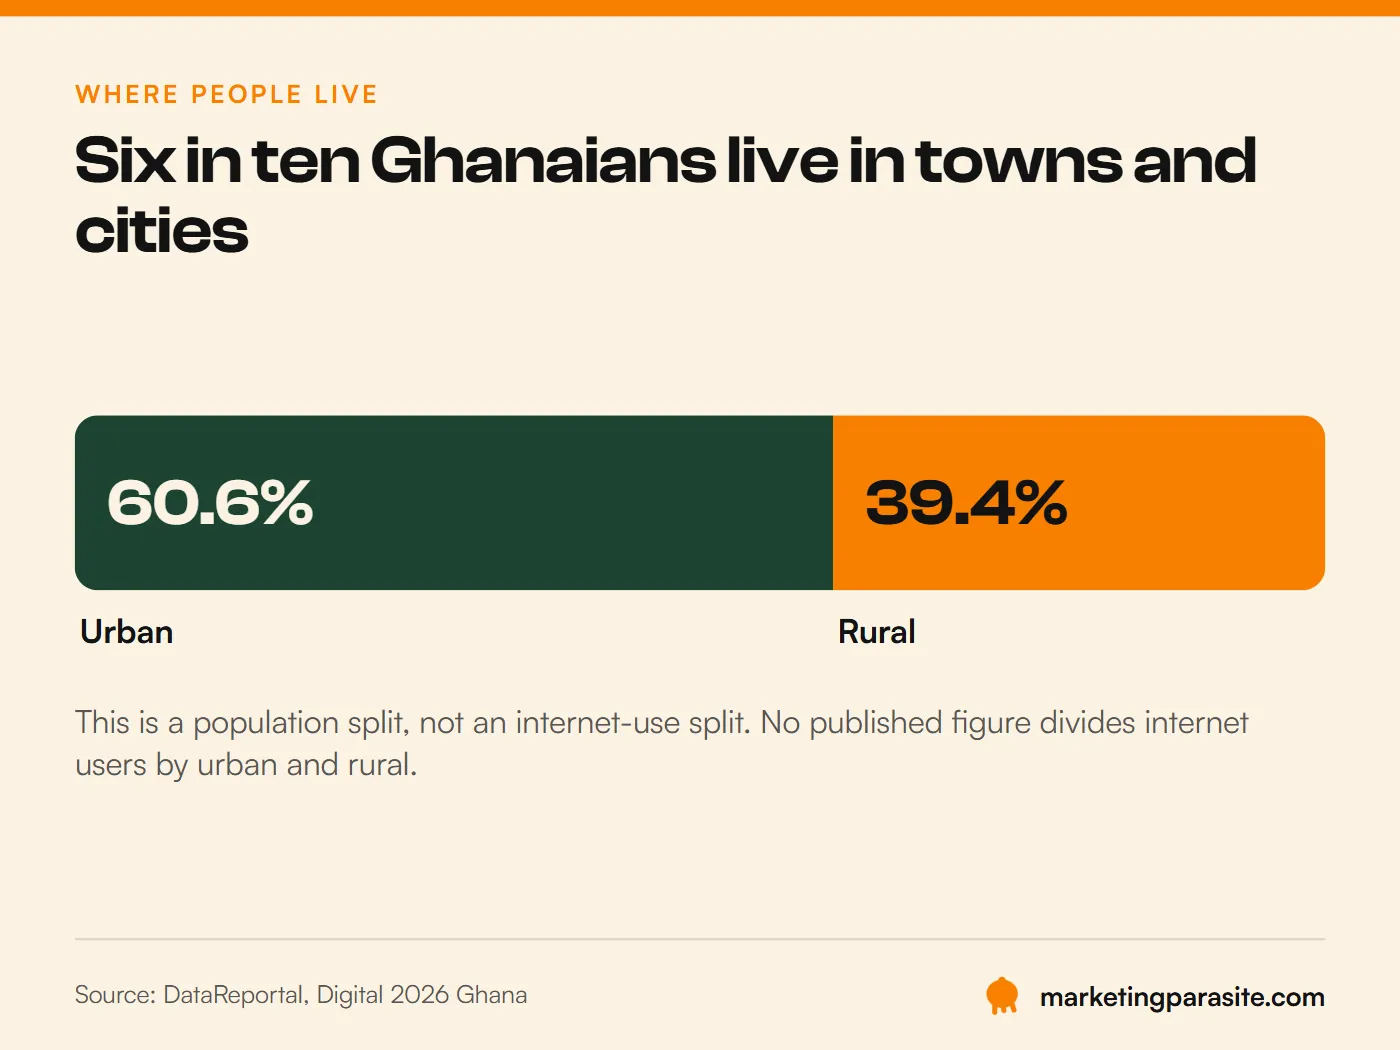
It still matters for planning. A business selling across the country faces different connections, delivery options and spending power from one selling only in Accra. A national average describes the whole market. It does not describe every town in it.
Data and fibre are still growing every quarter
Mobile data subscriptions rose from 26.72 million in March 2025 to 29.73 million in March 2026, according to the NCA. Fibre broadband grew faster in percentage terms, from 227,350 to 273,095 homes and businesses, a rise of about 20%.
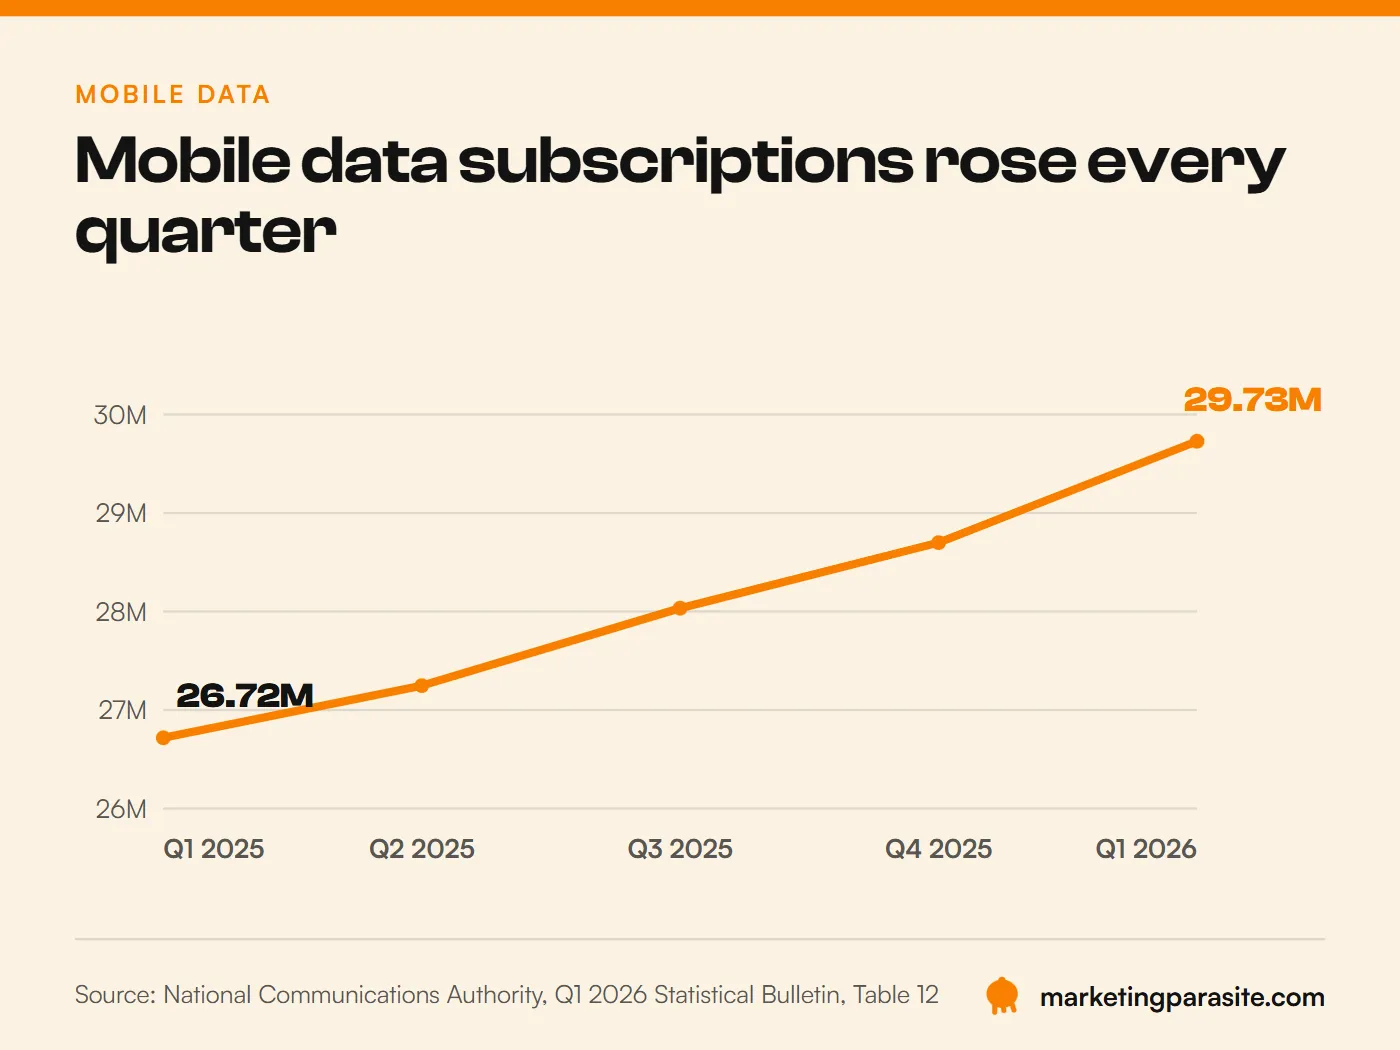
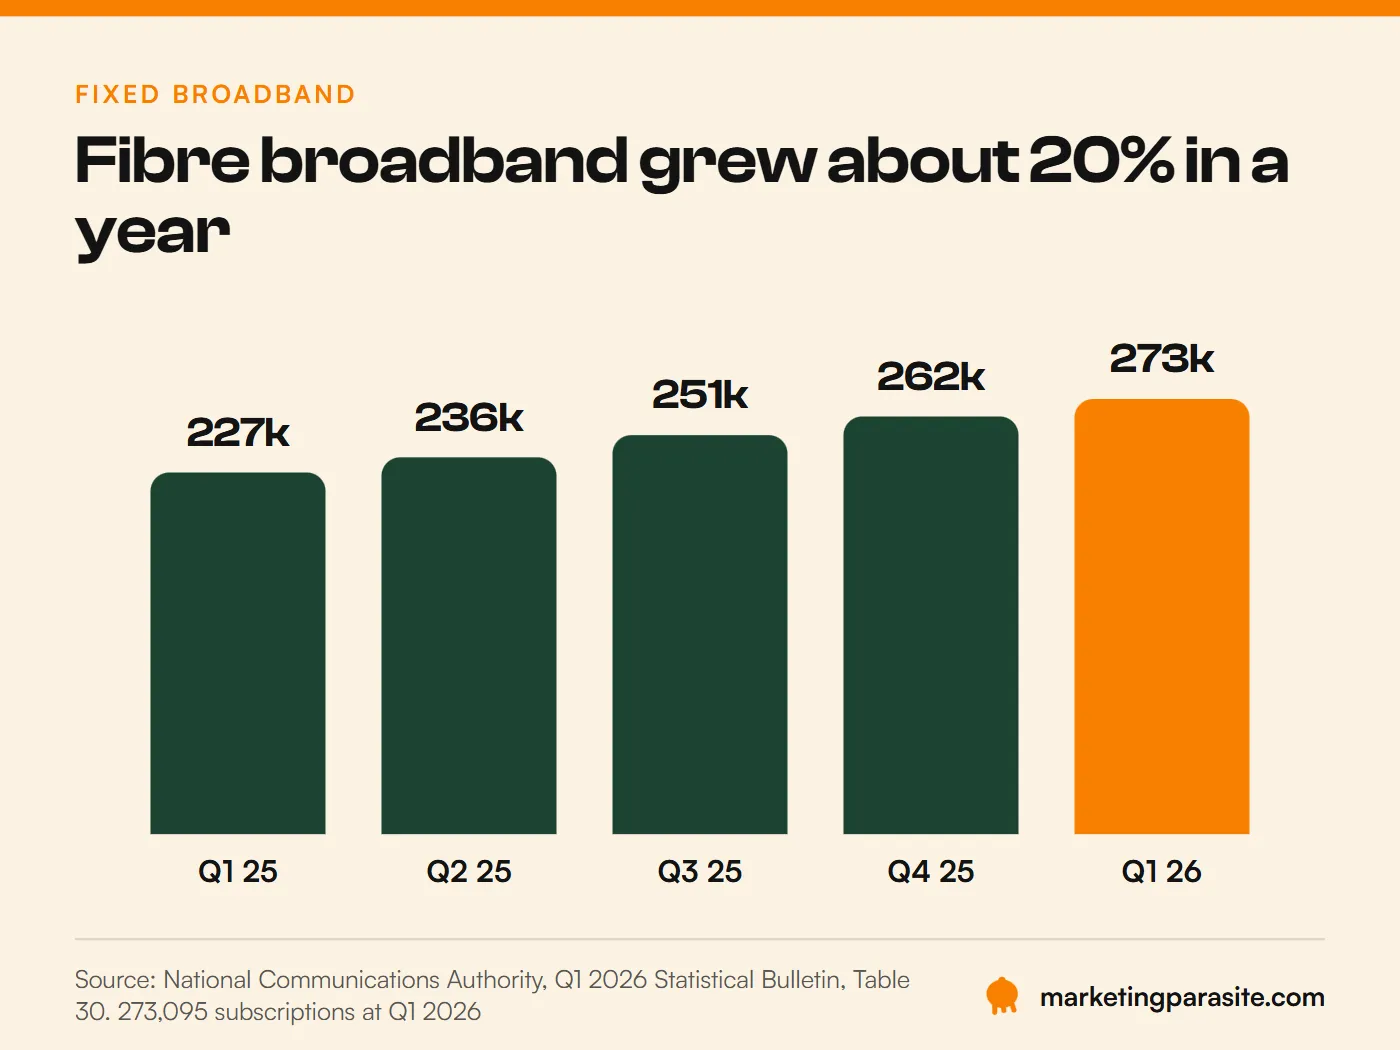
Most Ghanaians still reach your business on a phone, on mobile data. That is why the experience after the click matters as much as the click. A website that loads slowly on mobile data, or makes it hard to call or message you, loses people the statistics never count.
The biggest social media platforms are not always the biggest traffic drivers
Ghana had 8.59 million social media user identities in October 2025, about 24.4% of the population. Here is how they split by platform.
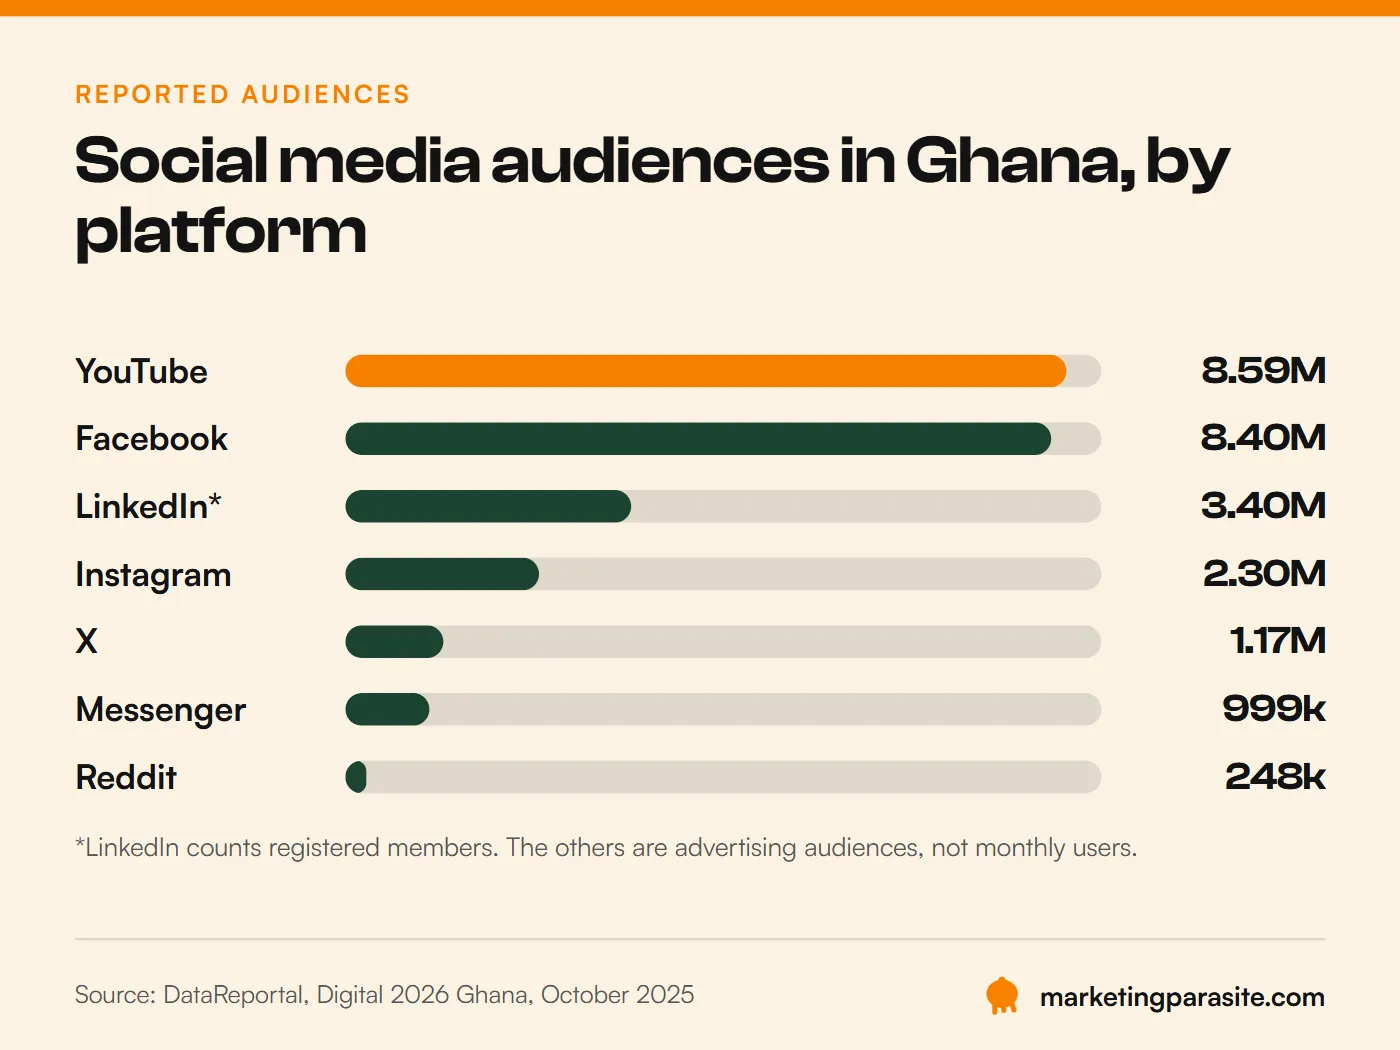
The figures are DataReportal’s, from Digital 2026 Ghana, October 2025. They are mostly advertising audiences: how many people a platform says its ads can reach. They are not counts of people who log in every month. LinkedIn is the odd one out. Its figure, equal to 16.5% of Ghanaian adults, is registered members, and an account opened five years ago and never touched still counts.
YouTube’s lead does not make it the better platform
YouTube’s reported audience is 8.59 million and Facebook’s is 8.40 million, a gap of about 190,000. On reach alone, they are level. Reach tells you how many people could see an ad. It does not tell you how many will click, enquire or buy.
The better question is not which platform has the most users. It is which one puts your business in front of the people most likely to act on your offer.
X shows why the make-up of an audience matters
X’s reported audience in Ghana is 1.17 million, down 18,500 (1.6%) on the year before. And 80.6% of it is male, the most lopsided audience of any platform in the report.
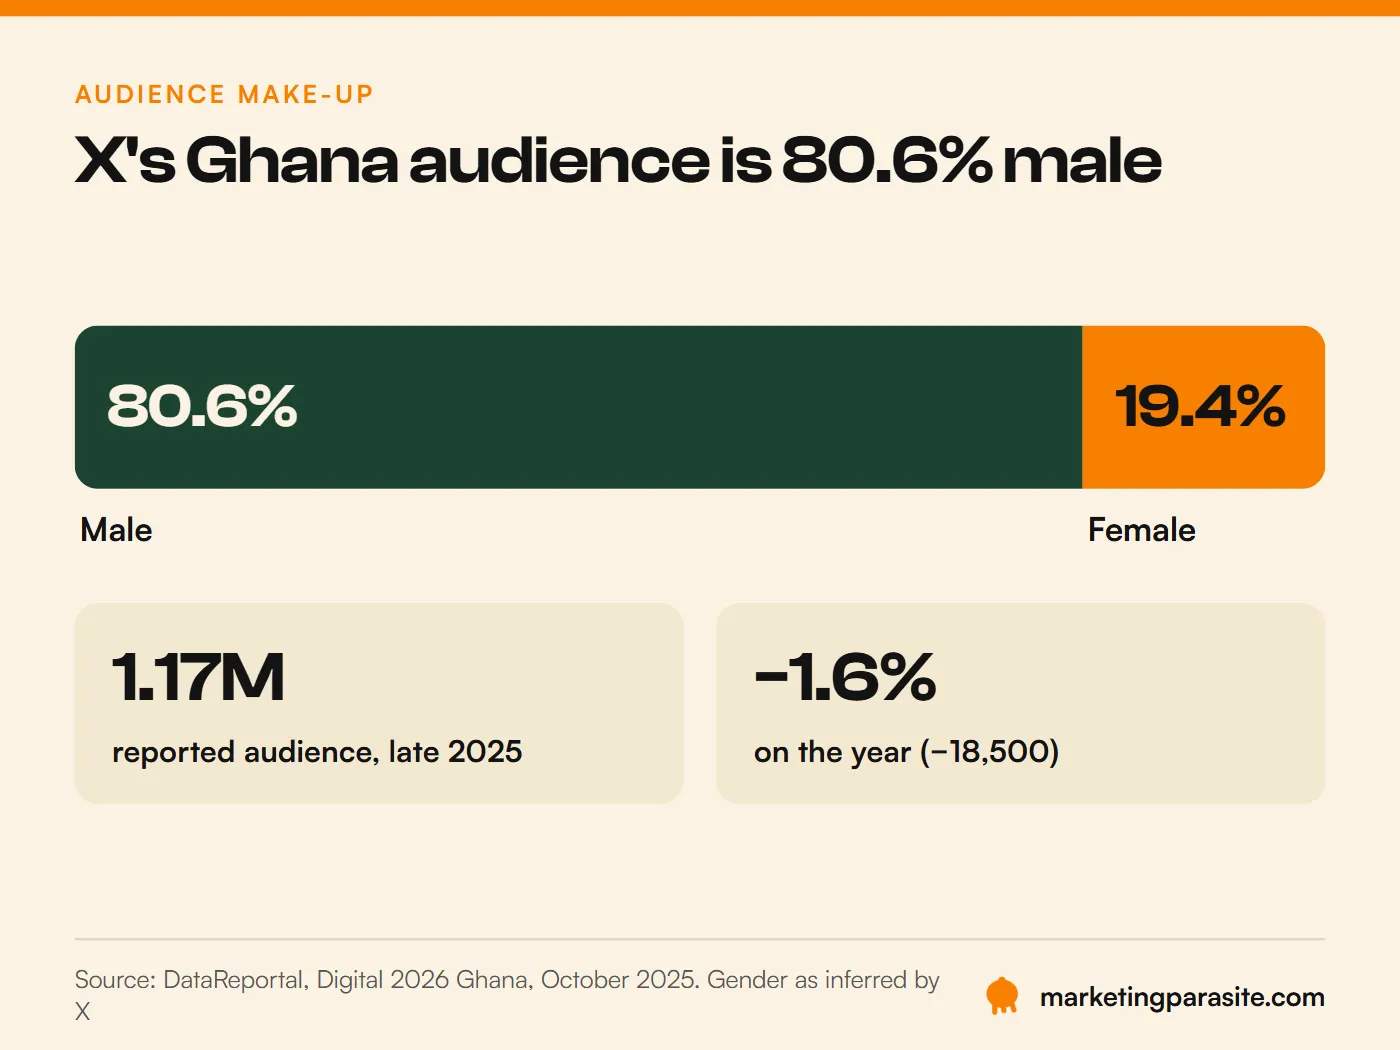
None of that makes X useless. It means a brand selling mainly to women should check who is actually there before it spends a cedi on paid social.
Facebook sends the traffic, but one month of data can fool you
Audience size tells you who a platform can reach. Referral data tells you something else: which platform people were on just before they landed on a website. StatCounter measures this for Ghana every month.
Social media referral traffic in Ghana
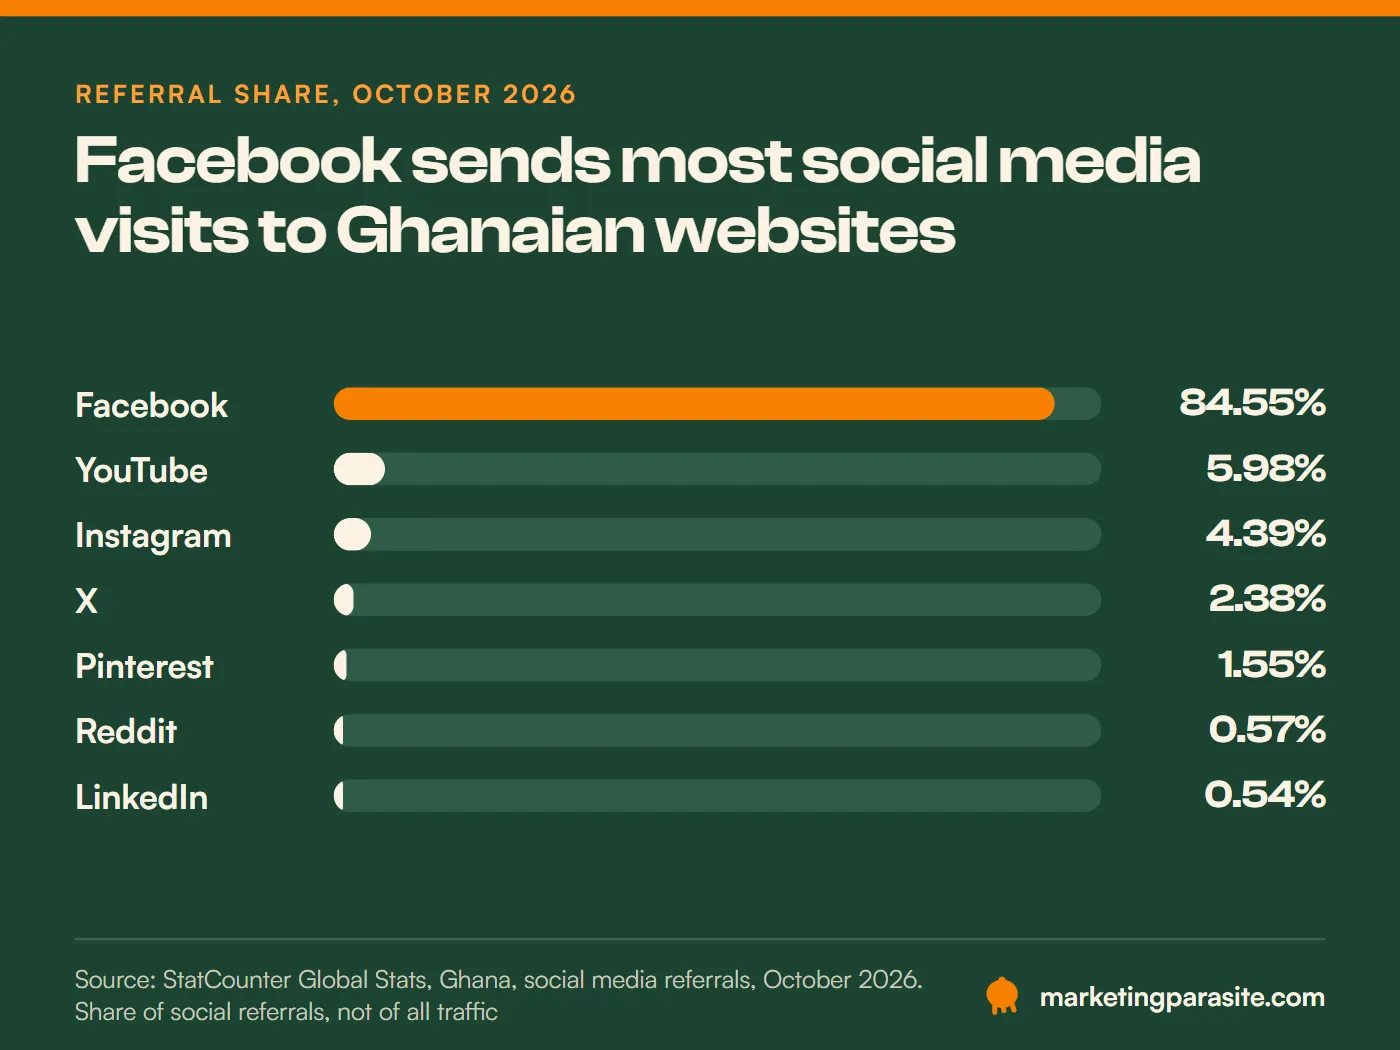
That is StatCounter Global Stats, Ghana, October 2026. These are shares of social media referrals only, not of all website traffic. Search, direct visits and everything else sit outside them.
Facebook led every month, but its share swung from 34% to 85%
Facebook was the top social referrer in Ghana in all 12 months. But its share moved wildly: 34.2% in May 2026, 84.6% in October. In the same year, Instagram peaked at 24.3% and fell to 4.4%.
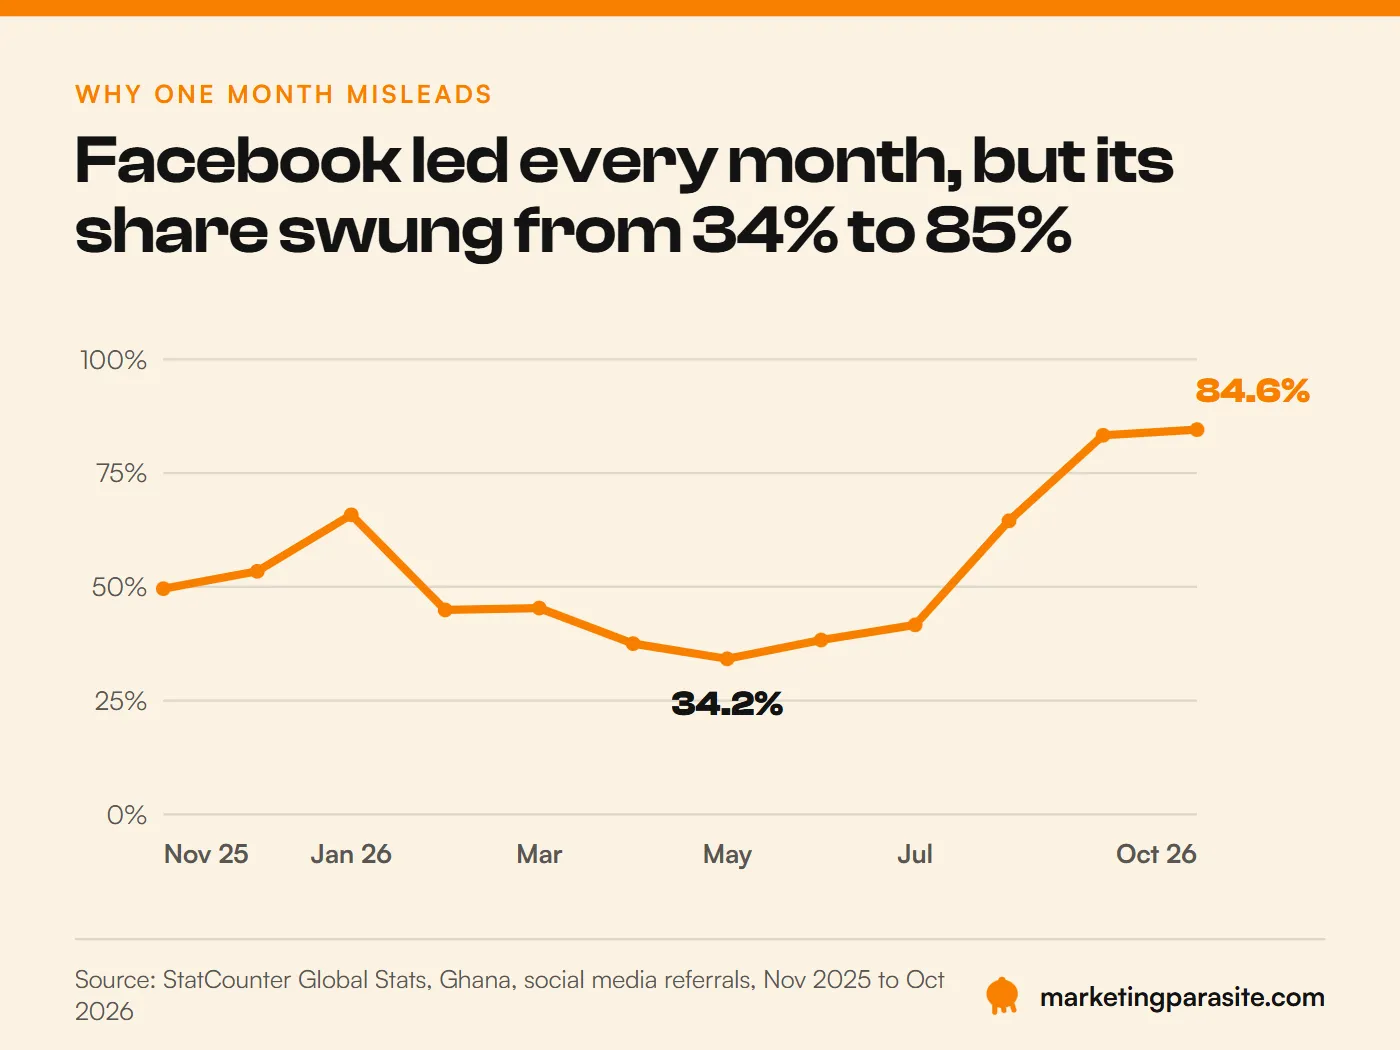
That is the most useful thing in this section. Any statistic quoting one month of referral data, including the one we used to publish, can be overturned the next month. Look at a year, not a snapshot.
Audience size and traffic do not line up
YouTube and Facebook have almost the same reported audience. Over the year, Facebook sent more than four times YouTube’s share of social referrals.
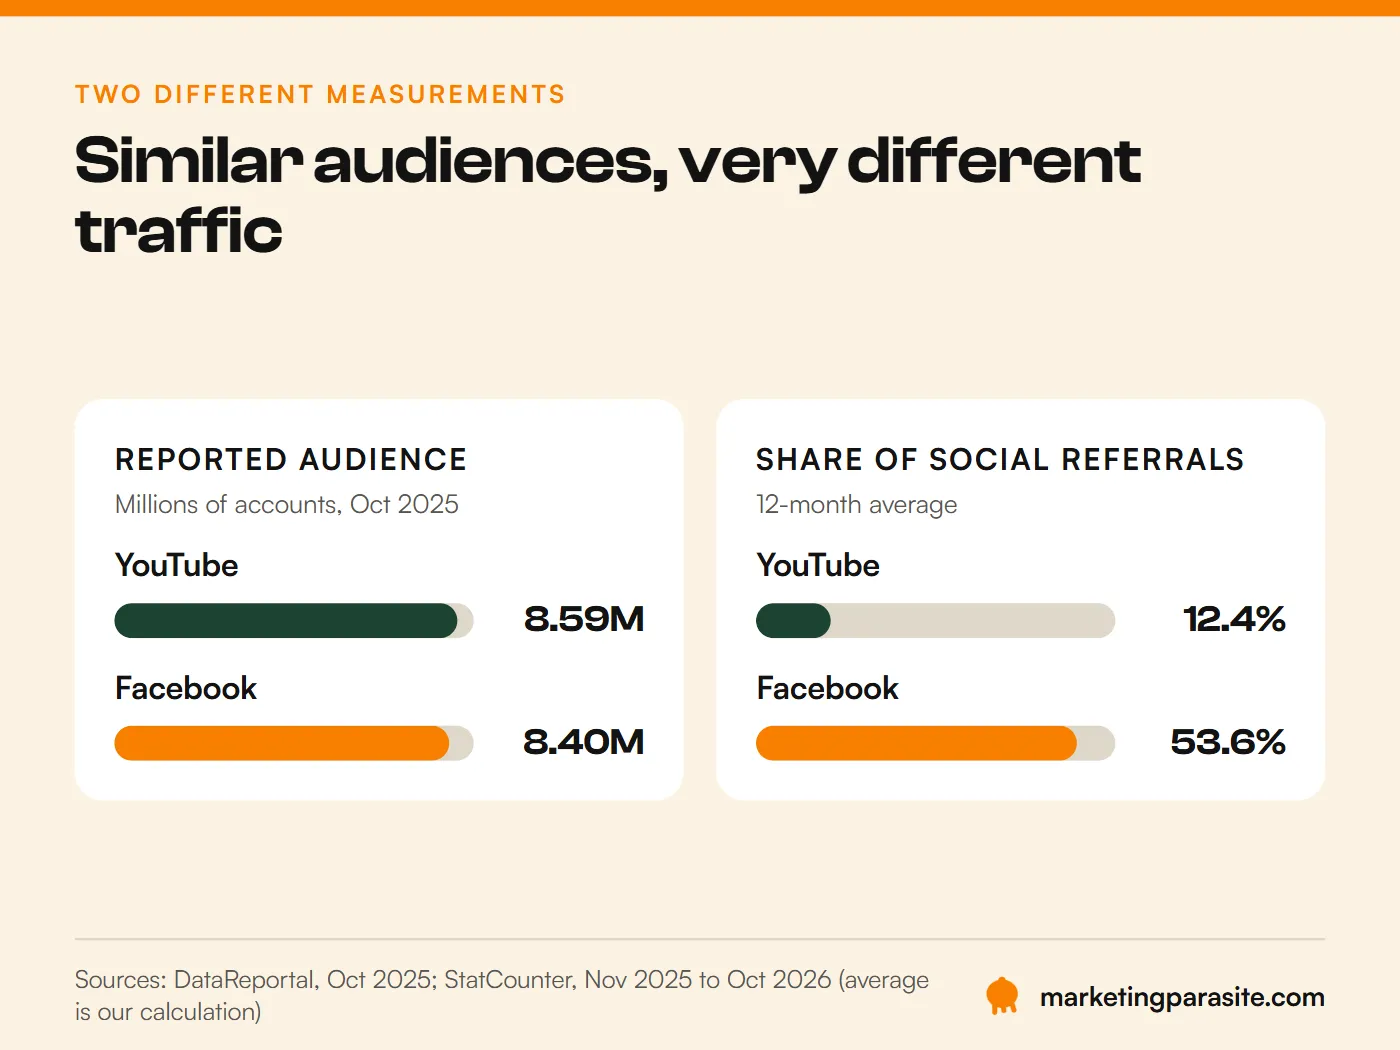
That does not prove Facebook is worth four times as much. People watch a brand on YouTube and search for it later, and no referral report sees that. What it does show is that a platform’s role in sending people to your website can be very different from its place in an audience ranking.
Pinterest: a real channel, not a reliable winner
Pinterest has no published advertising-reach figure for Ghana at all, yet it shows up in the referral data every month, averaging 7.0% over the year. From July to September 2026 it sent a bigger share than X. Over the full year, X was ahead.
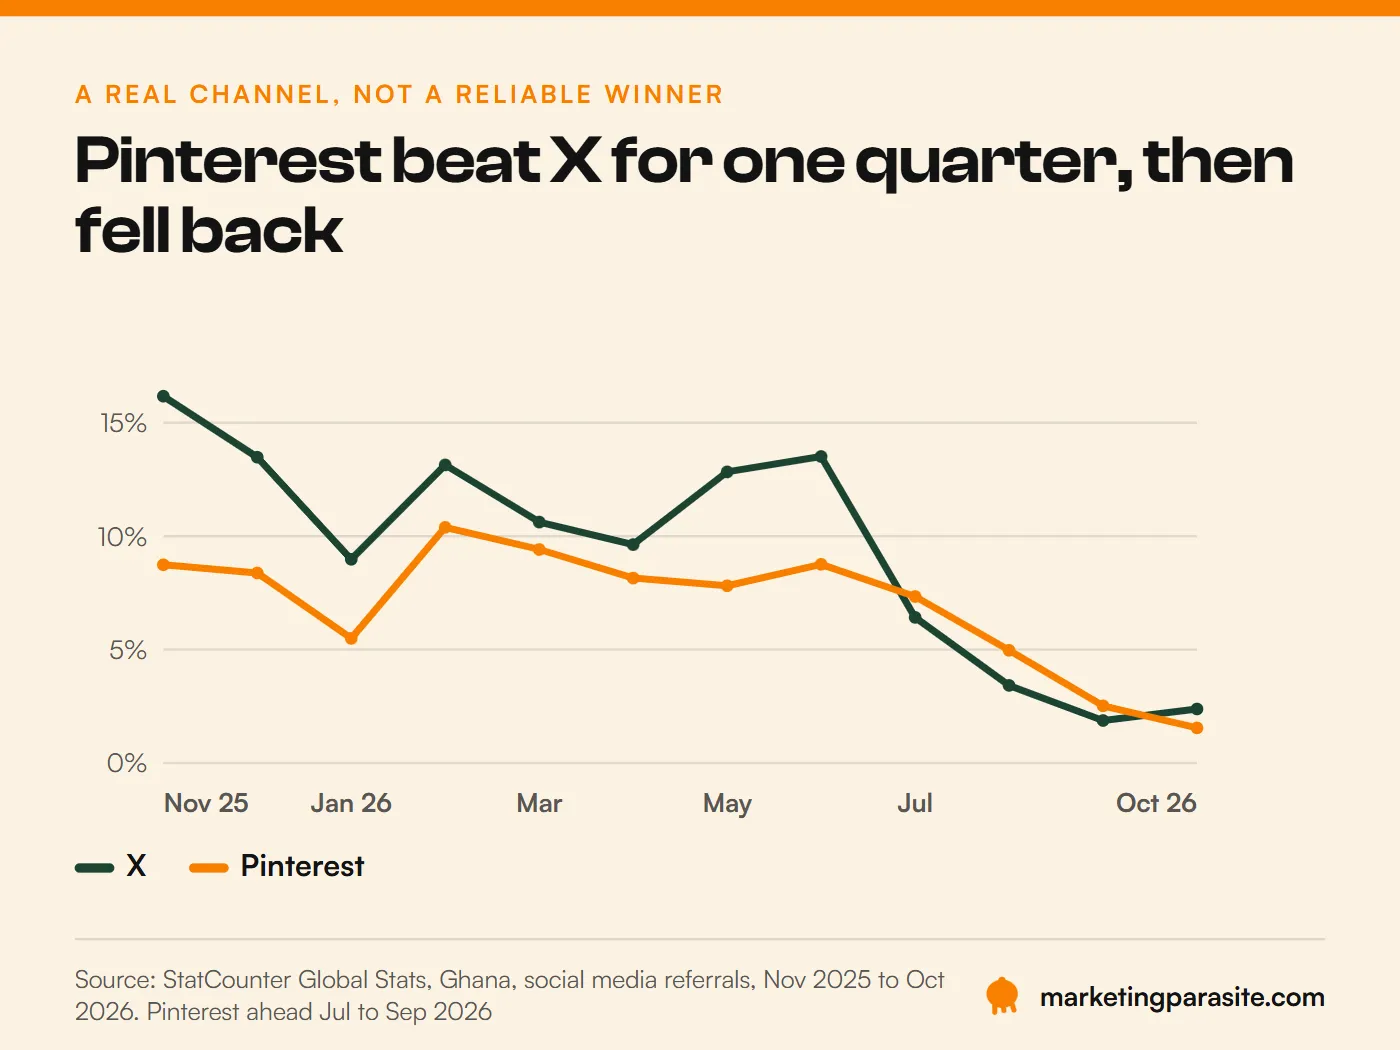
So do not move your budget to Pinterest on the strength of one good quarter. Do not write it off either just because it is missing from the usual audience tables.
A visit is not a sale
Two platforms can send the same number of visitors and produce completely different results. One sends people researching a topic. The other sends people ready to ask for a quote. Referral data cannot tell them apart. Only your own analytics and enquiry records can.
Reach, traffic and sales are three different measurements. A platform can lead on one and trail on the others, which is why social media marketing should be judged on enquiries, not followers.
Ghana’s payments tell one story. Online shopping tells another
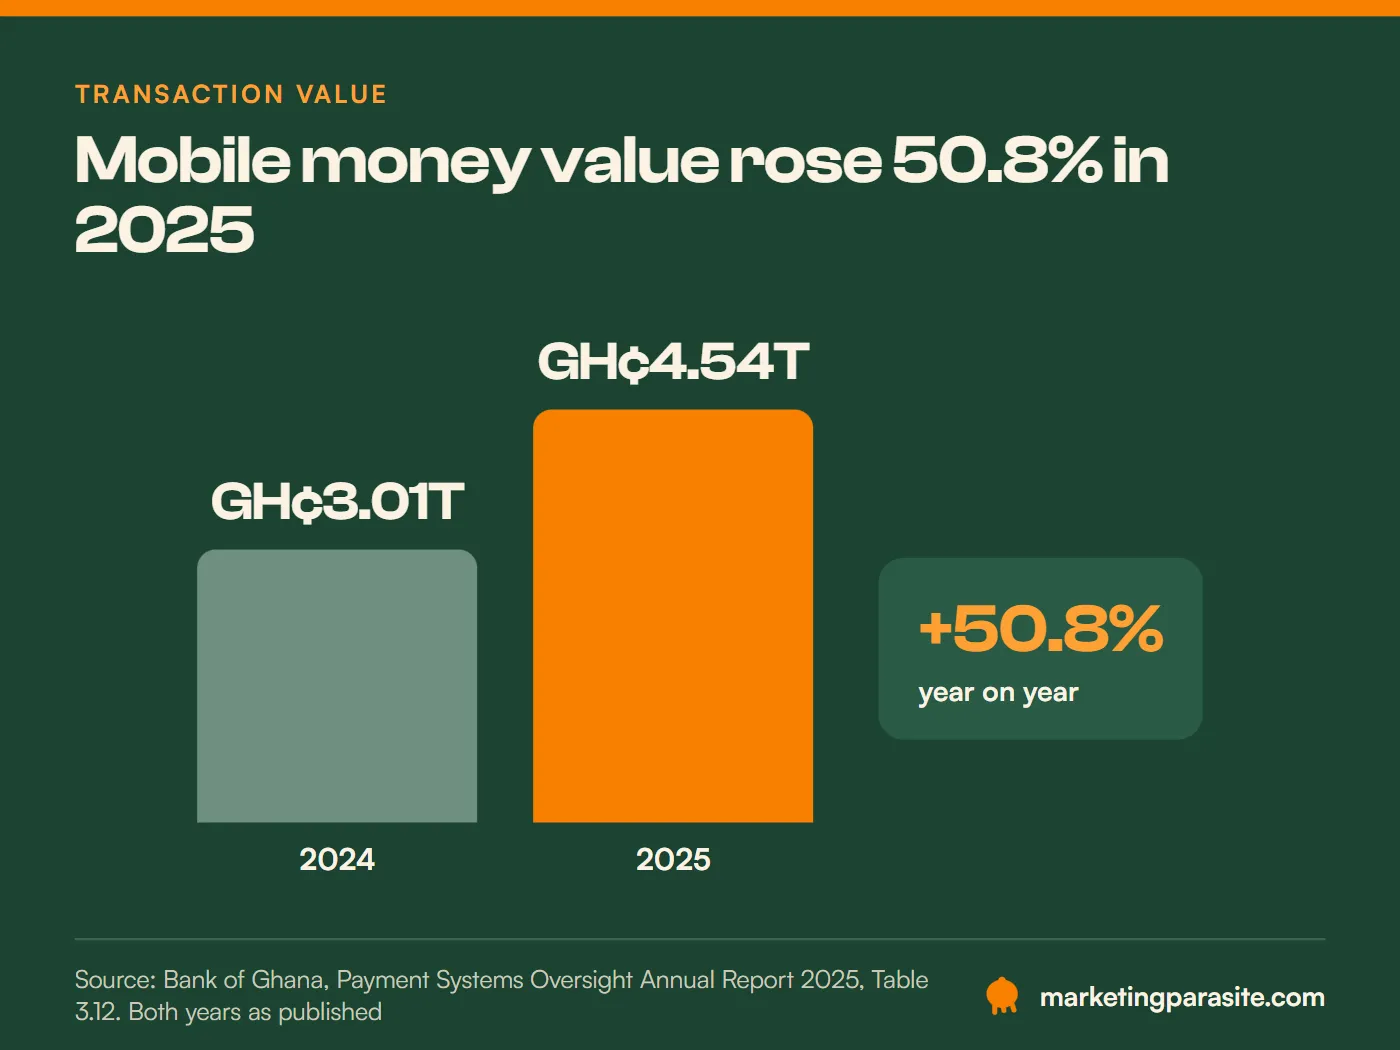
According to the Bank of Ghana, mobile money transactions were worth GH¢4.54 trillion in 2025, up 50.8% from GH¢3.01 trillion in 2024. There were 9.7 billion transactions.
Mobile money and e-commerce statistics
| Indicator | Figure | Source |
|---|---|---|
| Registered mobile money accounts | 80.5 million | Bank of Ghana |
| Active mobile money accounts (used in the last 90 days) | 26.7 million, up 13.5% | Bank of Ghana |
| Transaction value, 2025 | GH¢4.54 trillion, up 50.8% | Bank of Ghana |
| Number of transactions, 2025 | 9.7 billion, up 20.0% | Bank of Ghana |
| Active mobile money agents | 491,057, up 21.4% | Bank of Ghana |
| E-commerce revenue, 2025 | US$1,007 million | ECDB |
| Online share of all retail, 2025 | 0 to 5% | ECDB |
Sources: Bank of Ghana, Payment Systems Oversight Annual Report 2025, Table 3.12. ECDB, Ghana e-commerce market, 2025.
Registered is not the same as active
There are 80.5 million registered mobile money accounts in a country of 35.2 million, for the same reason there are more SIM cards than people. The figure that matters is the active one: 26.7 million accounts used at least once in the previous 90 days. That is about one in three.
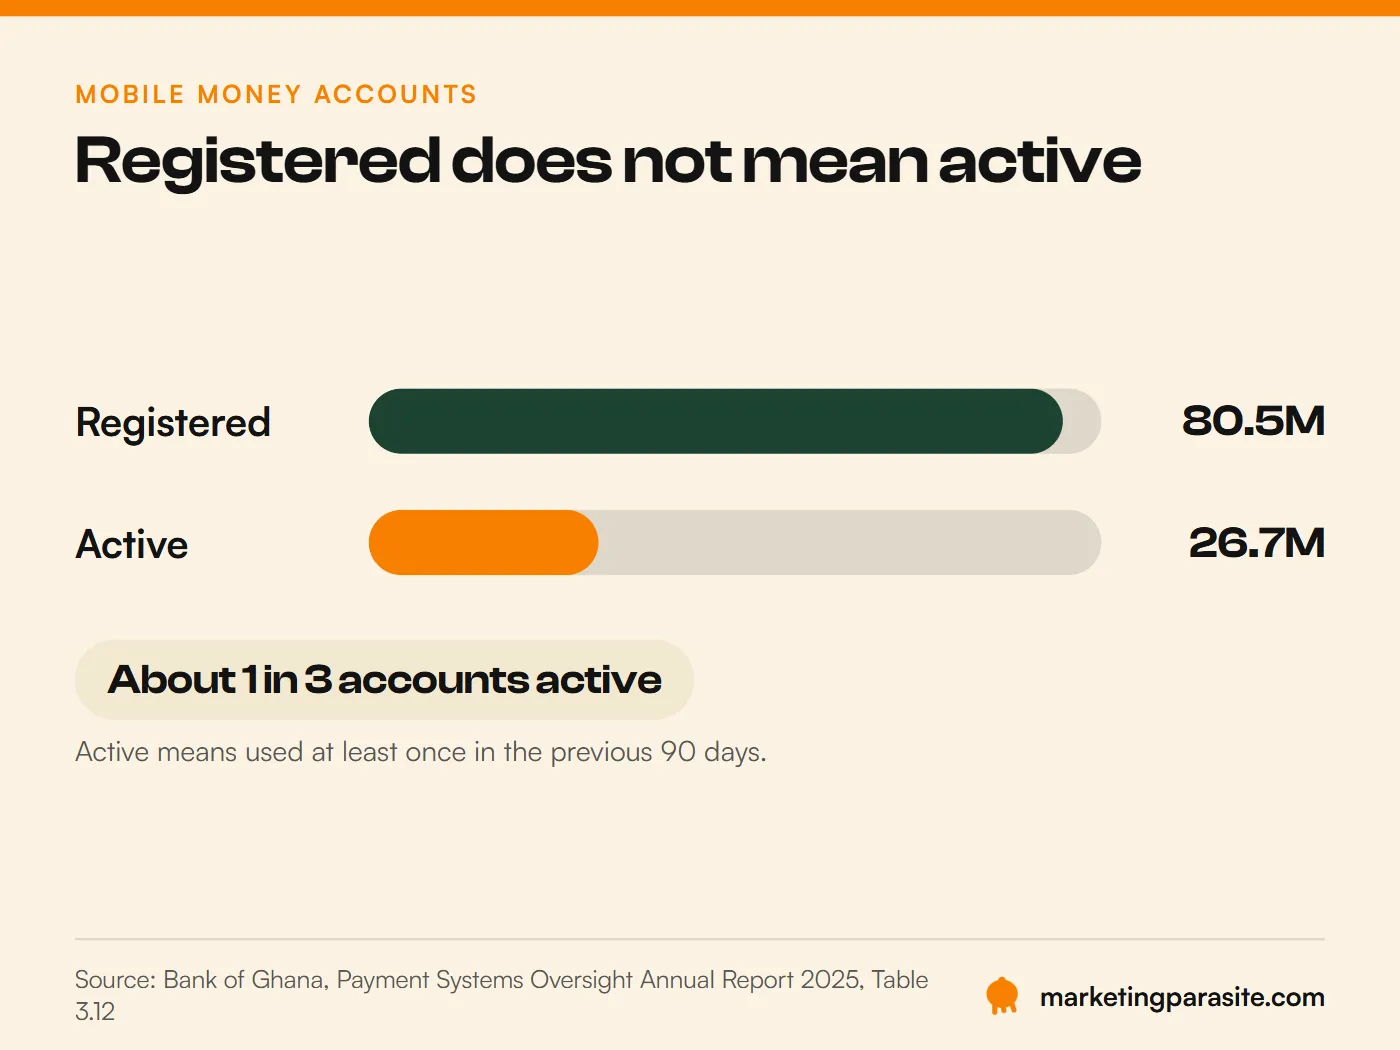
Even active accounts are not people, since one person can hold several. If you want to know how many customers can pay you by mobile money, start from the active figure, not the registered one.
GH¢4.54 trillion is not GH¢4.54 trillion of online sales
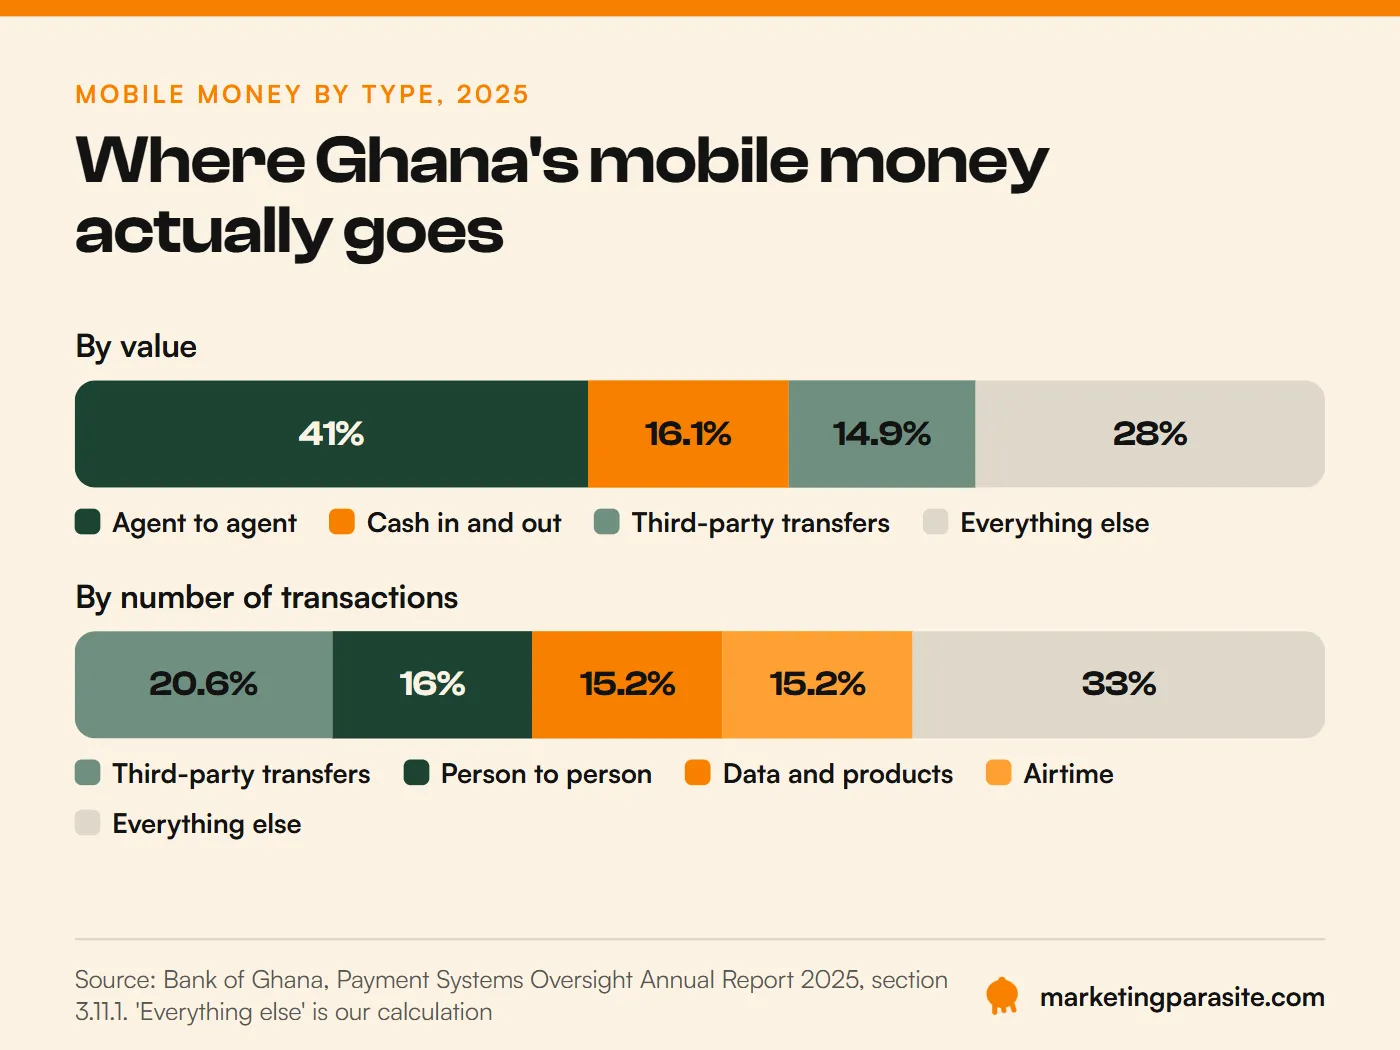
It is tempting to read payment growth as proof of e-commerce growth. It is not. The Bank of Ghana’s own breakdown shows where the value goes: 41.0% is agents moving money between themselves, and another 16.1% is cash going in and out. By number of transactions, the everyday uses lead: third-party transfers (20.6%), person-to-person transfers (16.0%), data and product purchases (15.2%) and airtime (15.2%).
The e-commerce figures tell a different story. ECDB puts Ghana’s online retail revenue at US$1,007 million in 2025, and the online share of all retail at 0 to 5%.
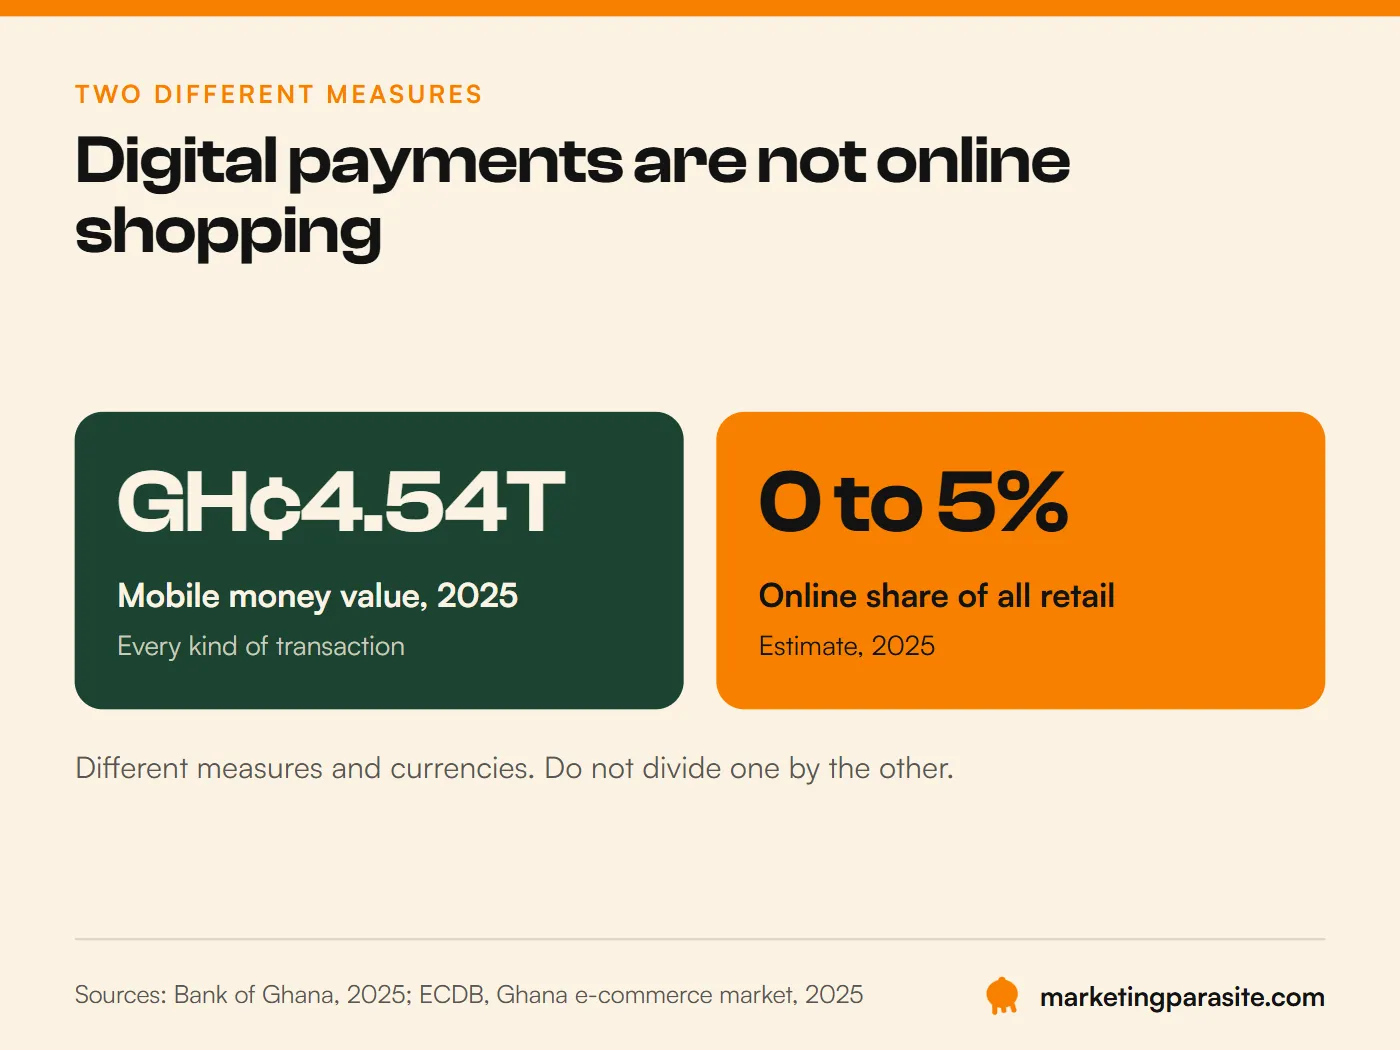
The two cannot be compared directly. They use different currencies and measure different things. But side by side they raise a fair question: if paying digitally is this normal, why is so little retail done online? The numbers cannot answer it. Shopping habits, delivery, trust and the products themselves all play a part.
What the numbers do show is simple. A huge digital payment system and a huge online shopping market are not the same thing. Customers still have to find you, understand what you sell and trust you before a payment method matters.
Ghana’s phones are not as Android-only as people assume
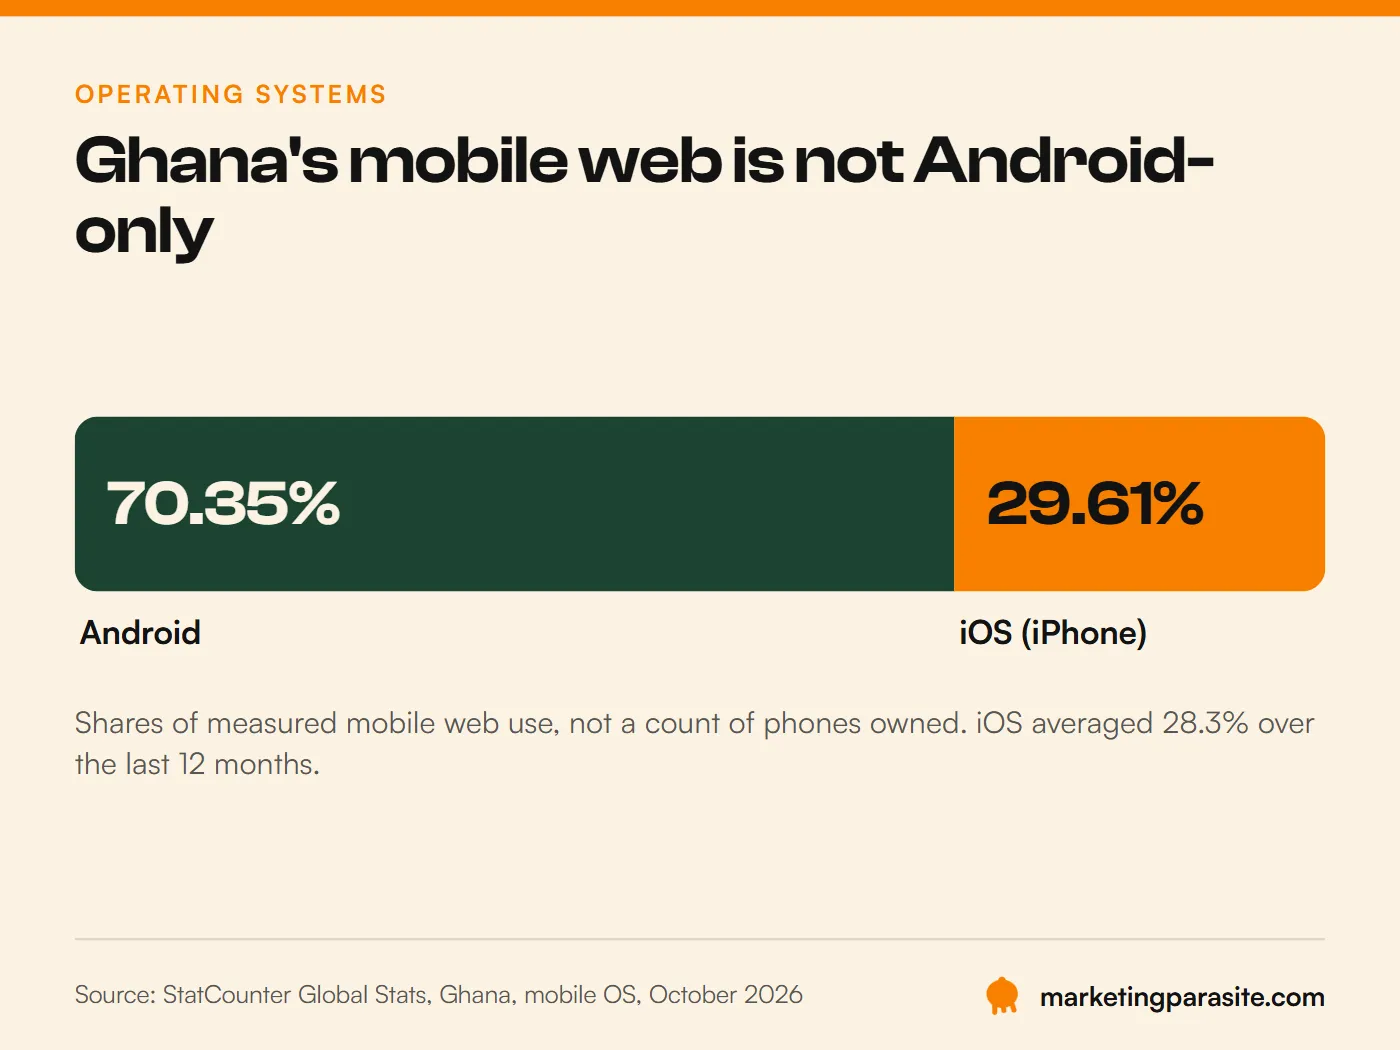
StatCounter measures which phones people use to browse the web. In October 2026, Android accounted for 70.35% of mobile web use in Ghana and iOS for 29.61%.
Samsung and Apple lead the phone brands
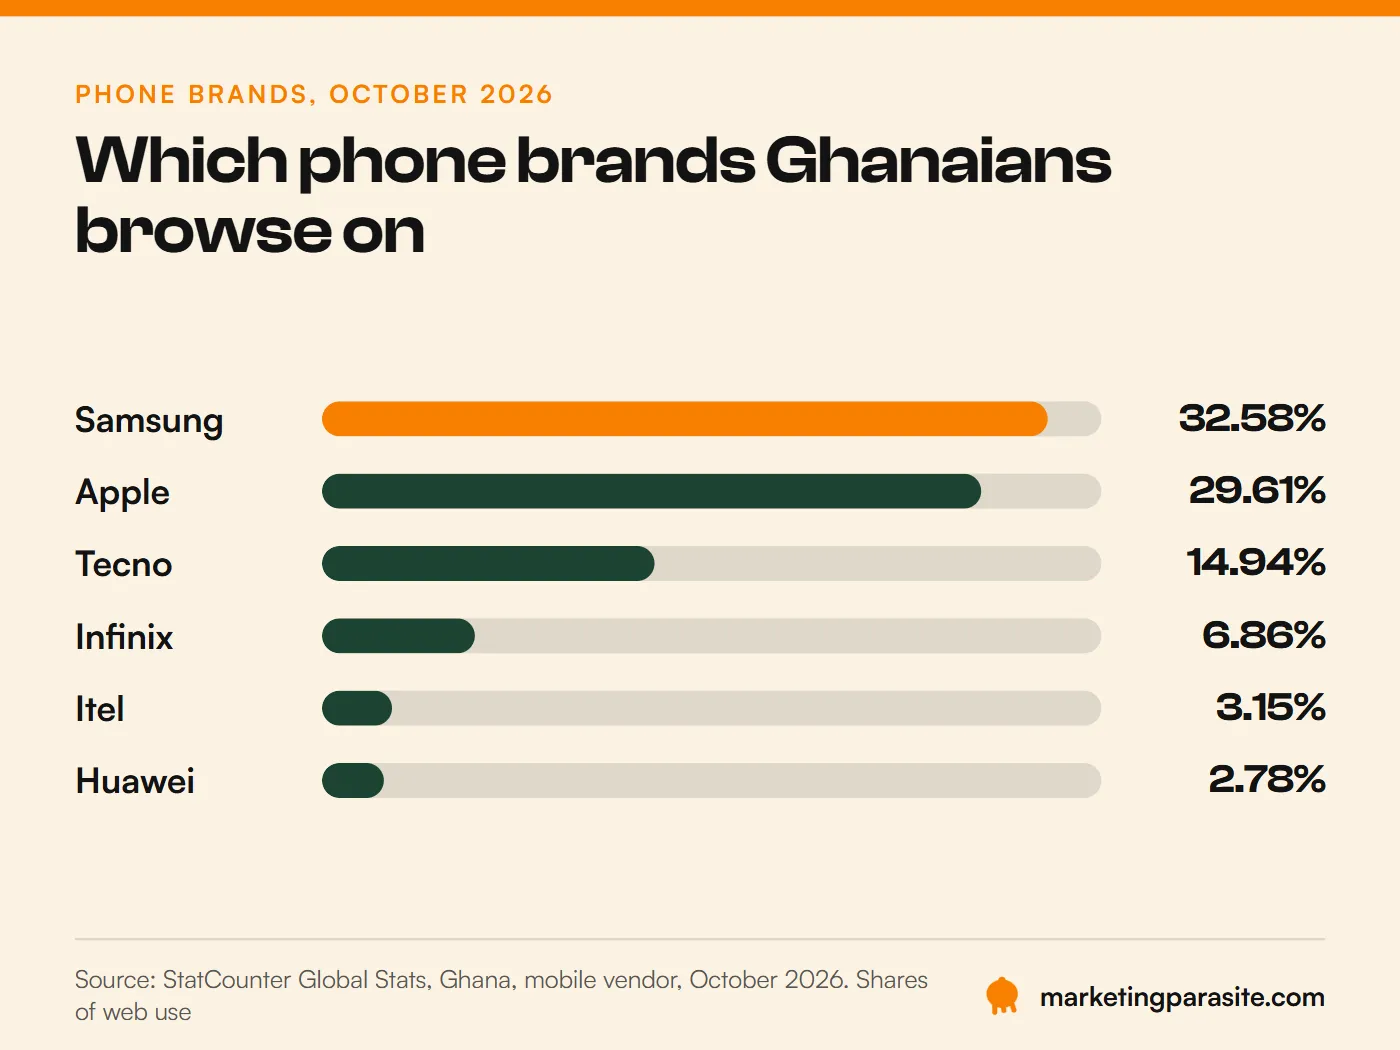
That is StatCounter Global Stats, Ghana, mobile vendor share, October 2026. Apple’s share moved between 22% and 34% over the year. It was ahead of Samsung for most of February to August 2026. From September, Samsung was back in front.
One caution. StatCounter counts web browsing on the sites it tracks, not phones in pockets. A phone used heavily for browsing counts for more than one that is mostly used for calls. So the finding is not that three in ten Ghanaian phones are iPhones. It is that iPhones account for about three in ten of the measured mobile web visits.
That is still a lot. A mobile app or website built and tested only on Android ignores nearly a third of Ghana’s measured mobile web audience. Whether an iOS app pays for itself depends on your customers, not on a national share.
The Ghana digital marketing statistics that are still missing
Some of the most useful findings are the numbers that do not exist. It is easy to find websites quoting an exact percentage for almost anything. It is much harder to find where those numbers came from.
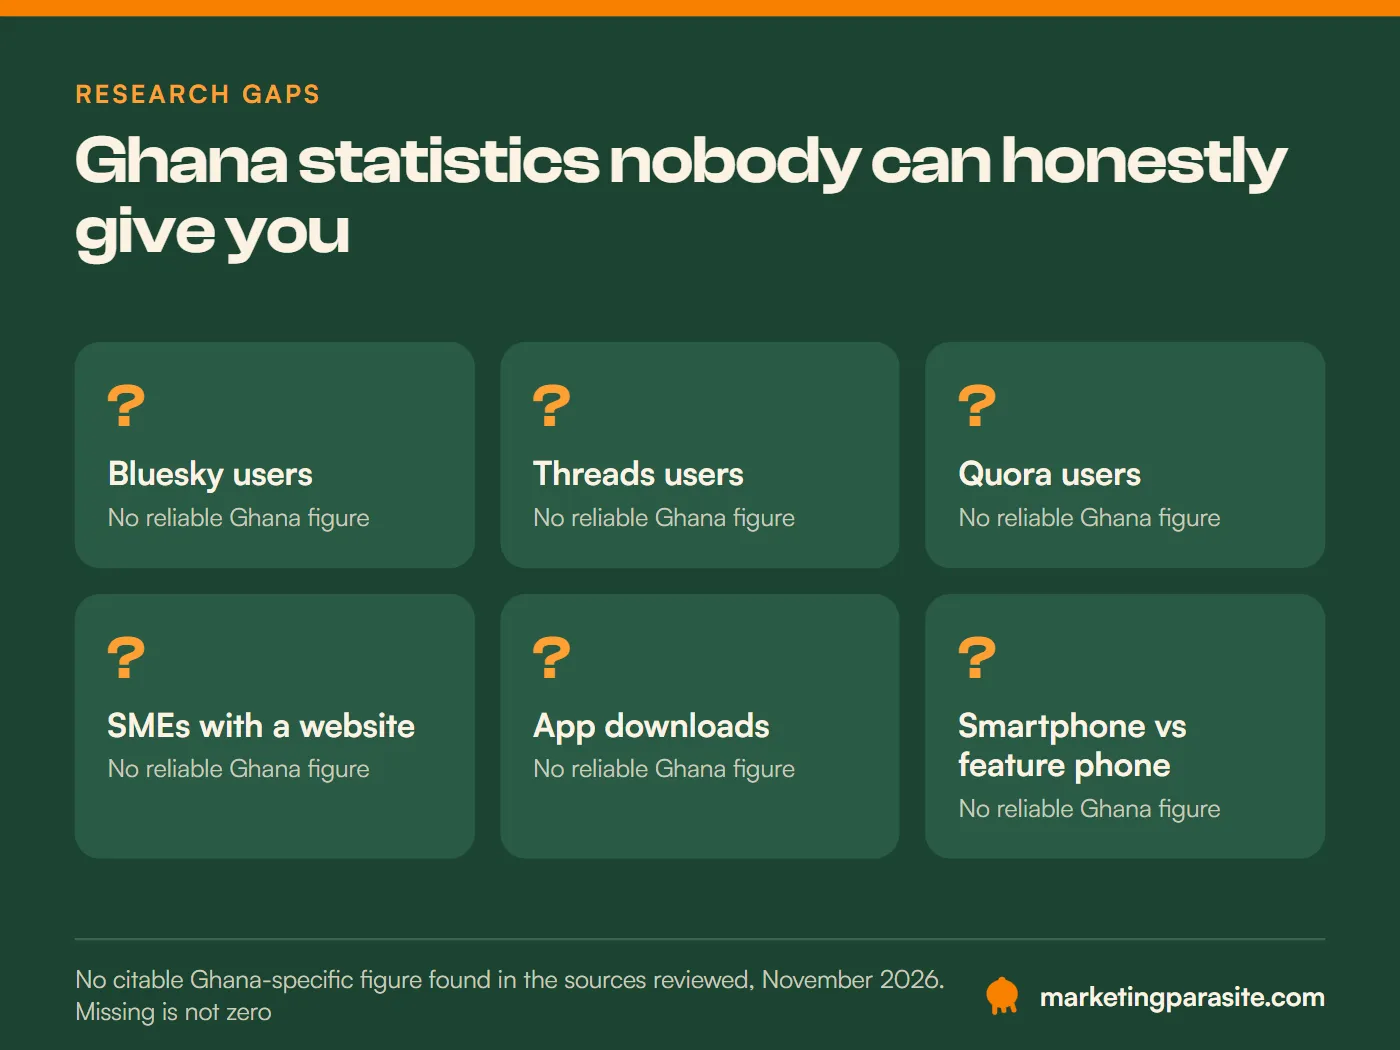
For each of these, we found no clear, citable Ghana figure:
- Bluesky, Threads and Quora users in Ghana. No country figure in any source we reviewed. That does not mean nobody uses them. It means nobody can honestly say how many do.
- Ghanaian SMEs with a website. No national figure with a clear method. It would also depend on what counts: does a Facebook page? A WhatsApp catalogue?
- Ghanaian SMEs that invest in branding. A “fewer than 24%” figure circulates in local papers, but it traces back to a 2016 study nobody can produce. We left it out.
- App downloads and app spending in Ghana. Commercial data firms may hold it. Nothing public is reliable enough to quote.
- Smartphones versus feature phones. Only Africa-wide estimates exist, and web statistics under-count feature phones by design.
A missing figure should stay missing, not be filled with a guess. If you see a percentage for any of these, ask where it came from.
The bigger gap is the questions businesses actually need answered. How many Ghanaian businesses get a real share of their sales from social media? What does it cost to win a paying customer through ads? How many people find a product online and buy it in a shop? National datasets cannot answer these. Your own campaign and sales data can.
So what do Ghana’s digital marketing numbers actually tell you?
Put together, the evidence says:
- The audience is growing. 2.1 million more Ghanaians came online in a year.
- Reach is not engagement. Millions of reported accounts do not mean millions of customers.
- Facebook sends the traffic. It led social referrals every month, although its share swung hard.
- One month of data misleads. Pinterest beat X for a quarter, then fell behind again.
- Payments are not purchases. Mobile money is enormous; online retail is still under 5%.
- iPhones matter. About three in ten measured mobile web visits.
What the figures do not support is the easy claim that digital marketing in Ghana is booming and every business should spend more online. Reaching people, getting their interest and turning that interest into revenue are three separate problems, and each needs its own evidence.
National statistics give you the context. Your website analytics, campaign results and sales records tell you what that context means for your business. The opportunity is not just that more Ghanaians are online. It is learning how they find, judge and buy from businesses like yours, and knowing where the data still runs out.
If you want a hand reading your own numbers against these, that is what our search engine optimisation and wider digital marketing work starts from.
Sources and method
Dates are the periods each source measured, not when you open it.
- DataReportal, Digital 2026 Ghana (published November 2025, mostly October 2025 data): population, internet users, mobile connections, social media audiences, download speed. datareportal.com/reports/digital-2026-ghana
- National Communications Authority, Q1 2026 Statistical Bulletin: mobile data and fibre broadband subscriptions, Q1 2025 to Q1 2026, Tables 12 and 30. Bulletin PDF
- StatCounter Global Stats, Ghana: social media referral share, mobile operating systems and mobile phone brands, monthly, November 2025 to October 2026. Social media, operating systems, phone brands
- Bank of Ghana, Payment Systems Oversight Annual Report 2025: mobile money accounts, agents, transaction value and volume (Table 3.12), and transaction types by value and volume (section 3.11.1). Report PDF
- ECDB, Ghana e-commerce market: e-commerce revenue and online share of retail, 2025. ecdb.com
These sources measure different things in different ways. Advertising audiences, web-usage shares and financial records are not counts of the same people, so none of them should be added to or divided by another. Where we compare them, the comparison is ours, not the publisher’s. Every figure was last checked on 15 November 2026.